Help needed from MSP gurus (charts inside)

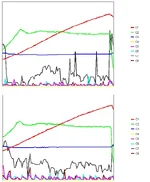
i can tell when the open loop on the stock ECU kicks in, its right where my car suddenly slows down from the fuel dump. it pulls well from about 3000 (after turbo spools) to about 3700 RPM and then feels like it bogged down hardcore.

This is kinda opposite of what my MSP is doing in closed loop. In closed loop (before ~4k rpm) the car is bogged down pretty bad, and then after 4k it gets a burst of power all the way to red line. It does seem a lot better now with the SS AFC and the power delivery seems a lot more smooth from 3-5k rpm.
 
^^ I think you said the afrs were really high before 4k rpm, which would be really lean, bogging down would be really rich afrs like 10s... I was pretty sure that the stock ecu just had a crappy tune and with the butterflies in the VTCS opening up around that rpm.. but I could be wrong..either way it is just part of the ecu's tune and it doesn't really matter why, it is because that is the way sparco I think it was tuned it.. or racingbeat I forget

but yes the ssafc does force it into open loop, again it is just a part of altering the signals going to the ecu, I am guessing there is a switch mechanism/signal that does this.. I don't know if anyone knows why, there may be someone on here that does, but it hasn't come up in any of the threads I have searched.. and it's not like you can get much info. on things for this car
 
The wide band was delivered today and I spent some time attempting to tune the SS AFC. Here are the charts of before and after and the map which I modified. (red=rpm green=boost gray=AFR) (does anyone know how to get better charts from the SSAFC software? Displaying numbers somewhere in the graph would be helpful)

Any tips would be greatly appreciated! Can the AFC be tuned better to have a smooth AFR chart or are they all wavy like mine?
 

Attachments

  • tuning.webp
    tuning.webp
    29.4 KB · Views: 367
  • chart.webp
    chart.webp
    75.4 KB · Views: 368
cool, well the afrs are set on the graph at a very small scale so they look like they are bouncing around but really if you just increased the scale it would look flat.. but you don't want that because you want to be able to fine tune it.. and no you can't really get it much flatter, as long as it is generally stable you'll get small adjustments in afr like +/- .5 or something like that with a good tune, and there will always be random dips and spikes and stuff like that

and as far as different charts, other than being able to see the values or what they are in the tables/legend thing on the sides (like I assume you noticed the afr levels and cell value and boost numbers on the side of the graph (it's not shown in the pic but you should see it pretty easily when you'll looking at them on the computer)
 

New Threads and Articles

Back