I was curious what effect different speeds would have on the MPG I would get since here in Utah, the urban speed limit is 70 MPH which generally means the lanes vary from <70 to 80 MPH so when there's not congestion, you often can select your desired speed and pick a corresponding lane. Much of Utah even has speed limits of 80 MPH (thank you UDOT, it saves time on road trips!) which means you can go at least 85 MPH without the risk of a ticket. But I limited this test to 80 MPH as there's not a place near by where I could conveniently drive the same stretch with speeds from 65 to 85 without the risk of getting pulled over. What effect does it have if I choose 80 MPH rather than 70?
Results here, details below.
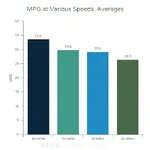
This graph shows the two runs for each speed averaged together:

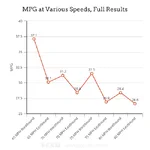
This graph shows each run seperately so you can see if a run looks like an anomaly that's potentially not valid. Personally, the 65 MPH Westbound seems like it MIGHT be too high but possible not. And the 75 MPH Westbound seems like it's probably inaccurate as it's not consistent with the trend seen in all other runs - meaning all the other runs showed a lower MPG with an increase in speed but the 75 MPH Westbound does not as it's MPG is better than the 70 MPH Westbound.

I would like to run this test on a different stretch of freeway and average it together with this run to dilute any variables and therefore get more accurate numbers.
I drove a 5.3 mile stretch of freeway at 65, 70, 75, and 80 MPH. One run each way of the freeway at each speed using cruise control. I measured the MPG using the on-board computer. I tried to keep no cars in front of me to prevent differences in aerodynamics between the test.
I ran the freeway in this order to spread out the two runs at each speed as much possible to minimize the effect of variables in between the speeds:
80 MPH Westbound, 65 MPH Eastbound.
70 MPH Westbound, 75 MPH Eastbound.
65 MPH Westbound, 80 MPH Eastbound
75 MPH Westbound, 70 MPH Eastbound.
The car: 2014 CX-5, FWD, 2.4 engine. 65,500 miles. Fairly aggressive all season tires. OEM roof side rails installed but not the crossbars. Chevron 85 octane gas. Windows up, AC on max with the fan on 3. Headlights on.
Things that happen to not be OEM: Air filter, tires, and the engine oil and filter are whatever Jiffy Lube put in when the previous owner took it there.
Results here, details below.
This graph shows the two runs for each speed averaged together:
This graph shows each run seperately so you can see if a run looks like an anomaly that's potentially not valid. Personally, the 65 MPH Westbound seems like it MIGHT be too high but possible not. And the 75 MPH Westbound seems like it's probably inaccurate as it's not consistent with the trend seen in all other runs - meaning all the other runs showed a lower MPG with an increase in speed but the 75 MPH Westbound does not as it's MPG is better than the 70 MPH Westbound.
I would like to run this test on a different stretch of freeway and average it together with this run to dilute any variables and therefore get more accurate numbers.
I drove a 5.3 mile stretch of freeway at 65, 70, 75, and 80 MPH. One run each way of the freeway at each speed using cruise control. I measured the MPG using the on-board computer. I tried to keep no cars in front of me to prevent differences in aerodynamics between the test.
I ran the freeway in this order to spread out the two runs at each speed as much possible to minimize the effect of variables in between the speeds:
80 MPH Westbound, 65 MPH Eastbound.
70 MPH Westbound, 75 MPH Eastbound.
65 MPH Westbound, 80 MPH Eastbound
75 MPH Westbound, 70 MPH Eastbound.
The car: 2014 CX-5, FWD, 2.4 engine. 65,500 miles. Fairly aggressive all season tires. OEM roof side rails installed but not the crossbars. Chevron 85 octane gas. Windows up, AC on max with the fan on 3. Headlights on.
Things that happen to not be OEM: Air filter, tires, and the engine oil and filter are whatever Jiffy Lube put in when the previous owner took it there.
Attachments
Last edited:


