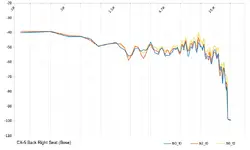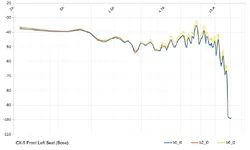
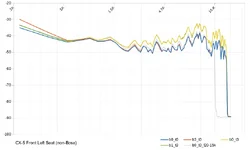
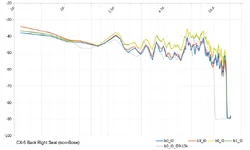
As ColtX-5 posted the response curve for Bose, I thought I should do the same for non-Bose for completeness.
The setup:
All audios, pics, and charts can be downloaded from this GDrive folder:
https://drive.google.com/open?id=0B1wdJ3PpKsLGV1VrTF9TMkloN3M
To keep the post short, I'm inserting just a few pics below. This is by no mean scientific, just a rough idea of the quality of the sound system. You can get more details by downloading the WAV files in the GDrive folder and analyze them yourself (for the audio, left channel maps to back-right seat, right channel maps to front-left seat).


The setup:
- closed garage, closed CX-5 doors and windows, engine not running
- 6-speaker system in 2016 Touring
- two AKG P170 mics to the front-left seat (right channel) and back-right seat (left channel)
- mics hooked to Tascam DR-40 recording a linear frequency-sweep generated in Audacity (computer to AUX)
- input level of DR-40 was low enough to minimize background noise
- frequency response data extracted out of the recorded WAV files using Plot Spectrum in Audacity
- data syntax: "b0_t3_f20-15k" means bass=0, treble=+3, frequency=20Hz-15KHz
- the frequency if omitted is 20Hz-20KHz (the shorter ranges just to show that the mics/speakers do work between 15K-20K)
All audios, pics, and charts can be downloaded from this GDrive folder:
https://drive.google.com/open?id=0B1wdJ3PpKsLGV1VrTF9TMkloN3M
To keep the post short, I'm inserting just a few pics below. This is by no mean scientific, just a rough idea of the quality of the sound system. You can get more details by downloading the WAV files in the GDrive folder and analyze them yourself (for the audio, left channel maps to back-right seat, right channel maps to front-left seat).
Attachments
Last edited:
")